Trend Infomation
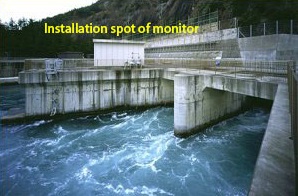
Discharge Canal Monitor
Discharge Canal Monitor
Nuclear power plant exhausts a minute amount of liquid radioactive material with thermal discharge.
At each power plant, the quantity of the exhausted liquid radioactive material is measured and analyzed in advance to confirm that it doesn’t affect the environment, and furthermore, the discharge canal monitor reconfirm the security finally.
At each power plant, the quantity of the exhausted liquid radioactive material is measured and analyzed in advance to confirm that it doesn’t affect the environment, and furthermore, the discharge canal monitor reconfirm the security finally.
Unit and Change of the Measuring Data
-
The measured value of the discharge canal monitor is expressed with the number of radiations that the detector measured in a unit time and is expressed in unit of cps (count per second).
A measured value of the exhaust stack monitor is expressed with the number of radiations that the detector measured in a unit time and is expressed in unit of cps (count per second).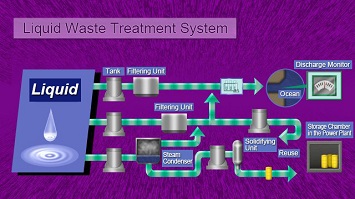
-
As a detecting unit of discharge canal monitor (NaI Scintillation detector) senses the radiation that natural radioactive nuclides contained in the seawater, surrounding wall material or the material of detecting unit itself emit, it detects the value within certain range(background value) even if radioactive waste is not released from the discharge canal.Like air radiation dose rate, when the rainwater pours into the outlet, measured value increases under the influence of the natural radioactive material contained in the rainwater. As the amount of rainwater pouring from the gutters in the site varies according to the facilities, the extent of the increase varies depending on each outlet.
Also, for the periodical inspection, the detecting unit of discharge canal monitor and a waiting spare detector are used in turn. As the background value of the detecting unit is specific to the detector, when the detector is exchanged, a difference may occur for the data before and after the exchange.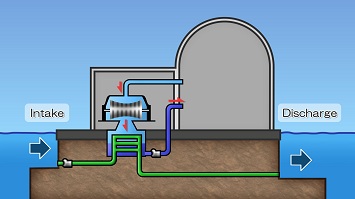
Display of the Discharge Canal Monitor Data
In this site, the discharge canal monitor data of the nuclear power plant is displayed as below
- Web Map Display・・・Discharge canal monitor data appears in the balloon, which is displayed by pointing the icon of the power plant displayed in the web map by the mouse. The data is displayed as latest 10 minutes data.
- Fixed Map Display・・・Discharge canal monitor data of each power plant is displayed on the map of “Near area around the power plant”. The data is displayed as latest 10 minutes data.
- Trend Graph Display・・・It is displayed as the time-series graph from past data to the current time for each power plant. 10 minutes data, one hour data, 4 hours data, and one day data are provided.
- Listed Display・・・Latest discharge canal monitor data of all power plants is displayed in 10 minutes data.
Names of Discharge Canal Monitors
Some of the discharge canals are shared between several power plants. This site provides the data of discharge canals listed below
| Power Plant | Discharge Canal Monitor |
|---|---|
| Tsuruga Power Plant 1 | suruga Power Plant 1 Discharge Canal Monitor |
| Tsuruga Power Plant 2 | suruga Power Plant 2 Discharge Canal Monitor |
| Fugen | Fugen Drainage Tank Monitor |
| Monju | Monju Outlet Monitor |
| Mihama Power Plant 1,Mihama Power Plant 2 | Mihama Power Plant 1&2 Discharge Canal Monitor |
| Mihama Power Plant 3 | Mihama Power Plant 3 Discharge Canal Monitor |
| Ooi Power Plant 1,Ooi Power Plant 2 | Ooi Power Plant 1&2 Discharge Canal Monitor |
| Ooi Power Plant 3,Ooi Power Plant 4 | Ooi Power Plant 3&4 Discharge Canal Monitor |
| Takahama Power Plant 1,Takahama Power Plant 2 | Takahama Power Plant 1&2 Discharge Canal Monitor |
| Takahama Power Plant 3,Takahama Power Plant 4 | Takahama Power Plant 3&4 Discharge Canal Monitor |